corner radius
line width
iteration level
number of repeats u_params.w
start and end sides of path
u_params2.x
u_params2.y
background
colour
0
scale image
animation speed
Number of curves:
Distortion options:
strip along bottom:
(Operation Sequence)
Preset images:
download jpg
params are: time, width, shade, stage, breakone, linescale, breakadjust
Descriptions of background options:
0: black;
1: white;
2-5: 4 different kinds of grids of black lines on white background;
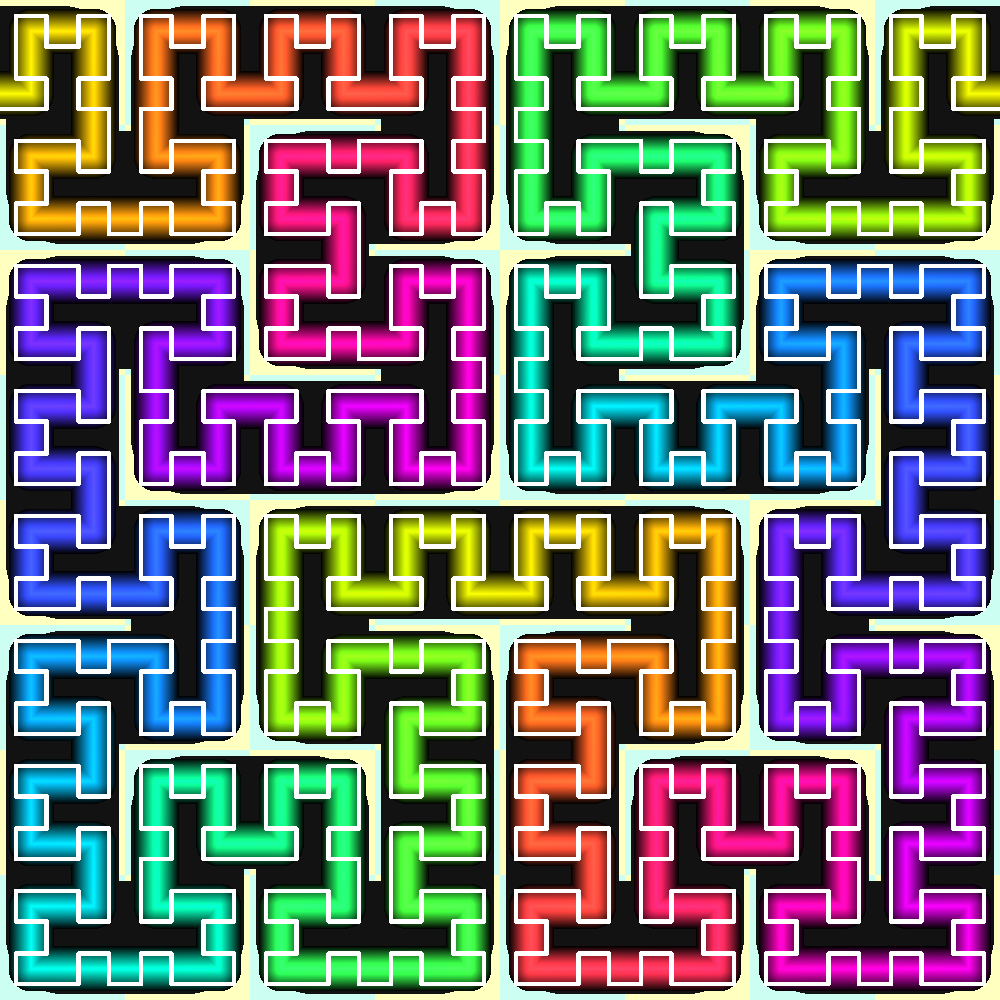
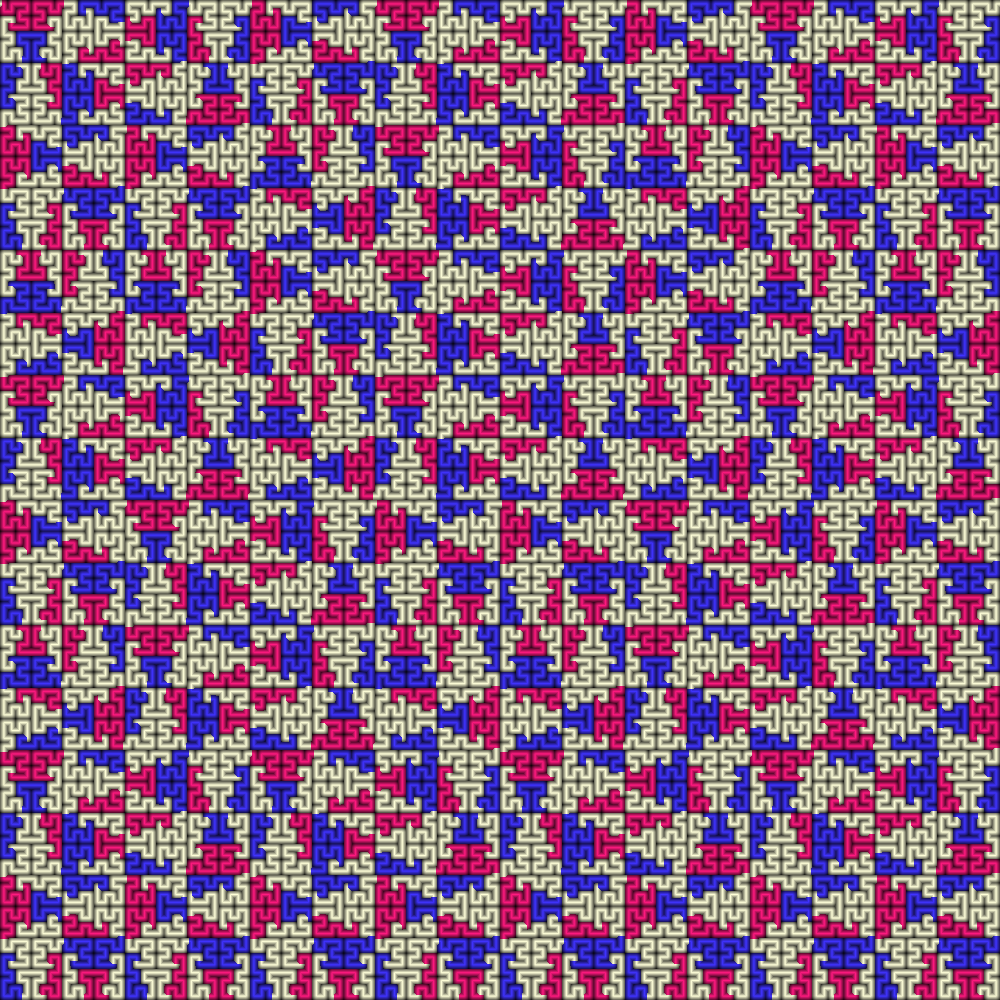
6-10: square is coloured according to whether the path through the square:
6: goes straight head (yellow), left (blue), or right (black).
7: starts at the top (pale blue), bottom (pink), left (blue), right (yellow).
8: whether at the entry point to the square, on increasing iteration level, path
start point shifts to left (pink) or right (purple).
9: The path consists of a "bump" which points up (like an n) (red), down (like a U) (pale purple/blue),
right (like a D without a vertical line) (yellow/cream), or left (like a C) (green).
10: Same as 9, but also with a grid.
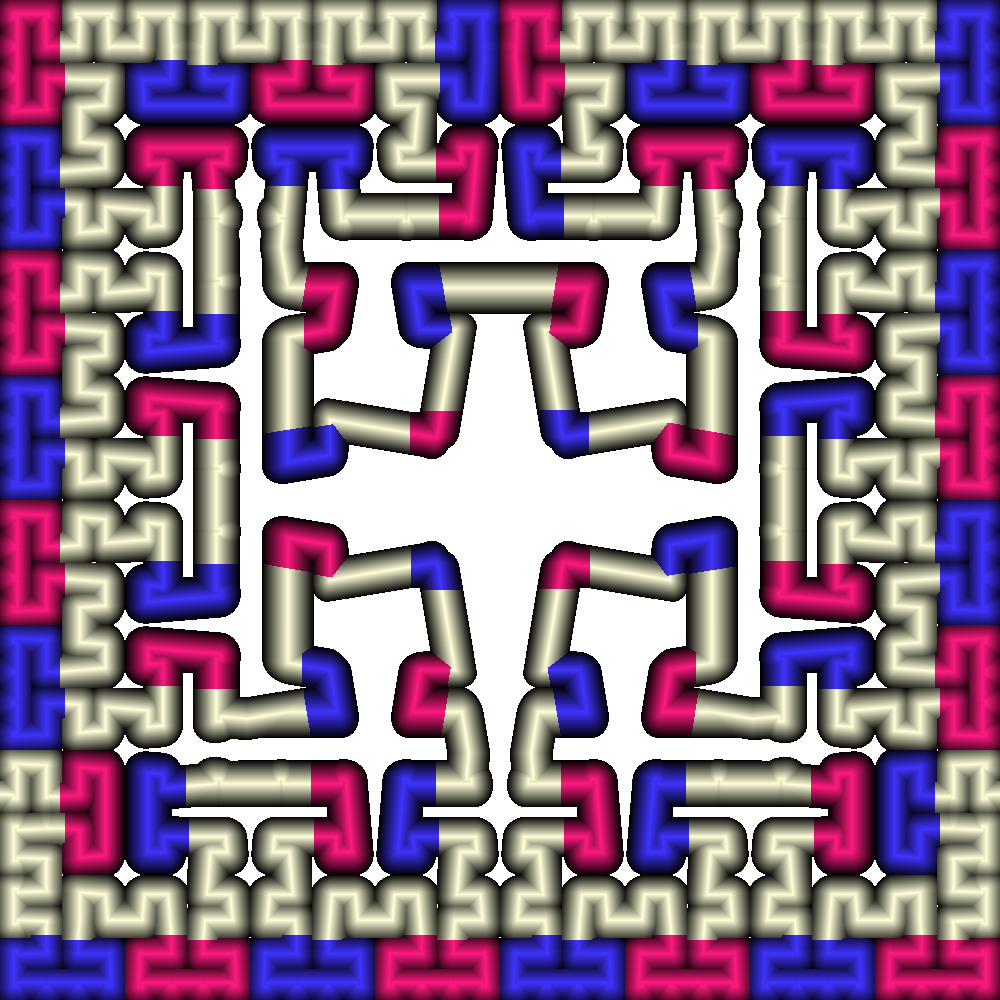
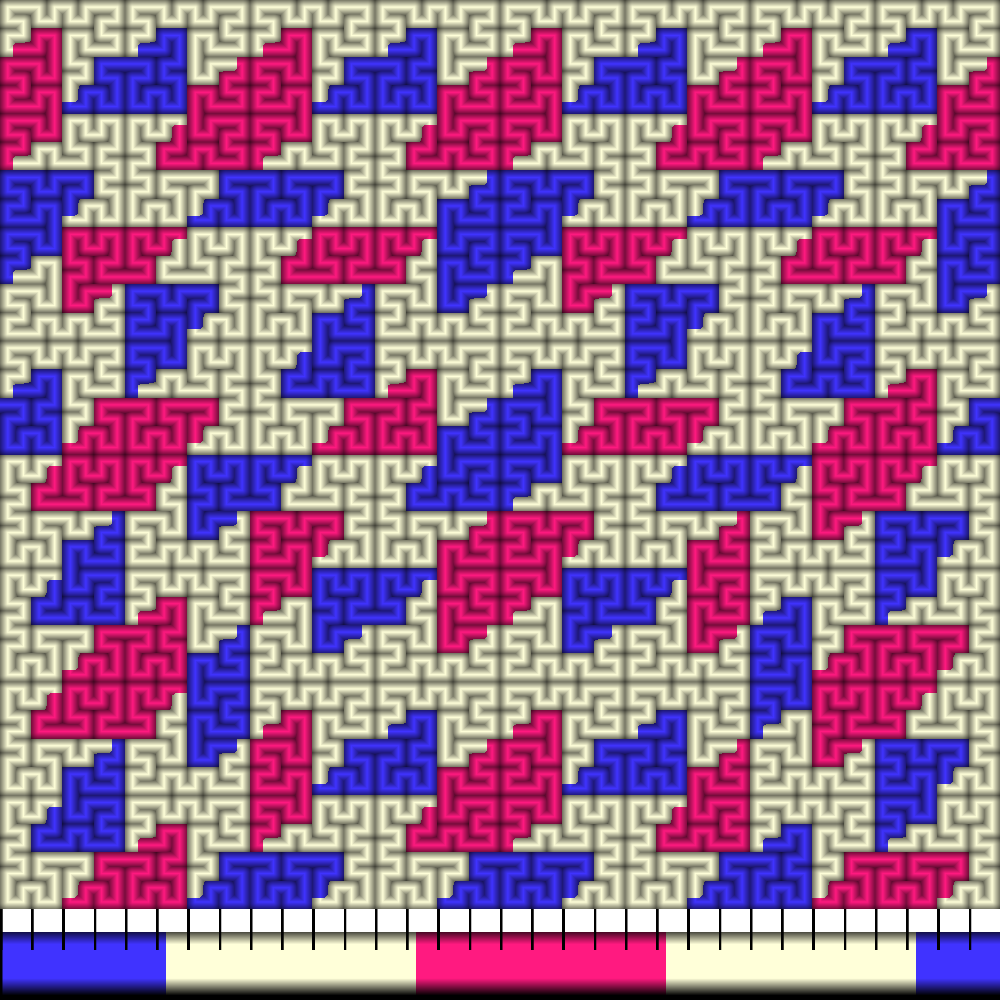
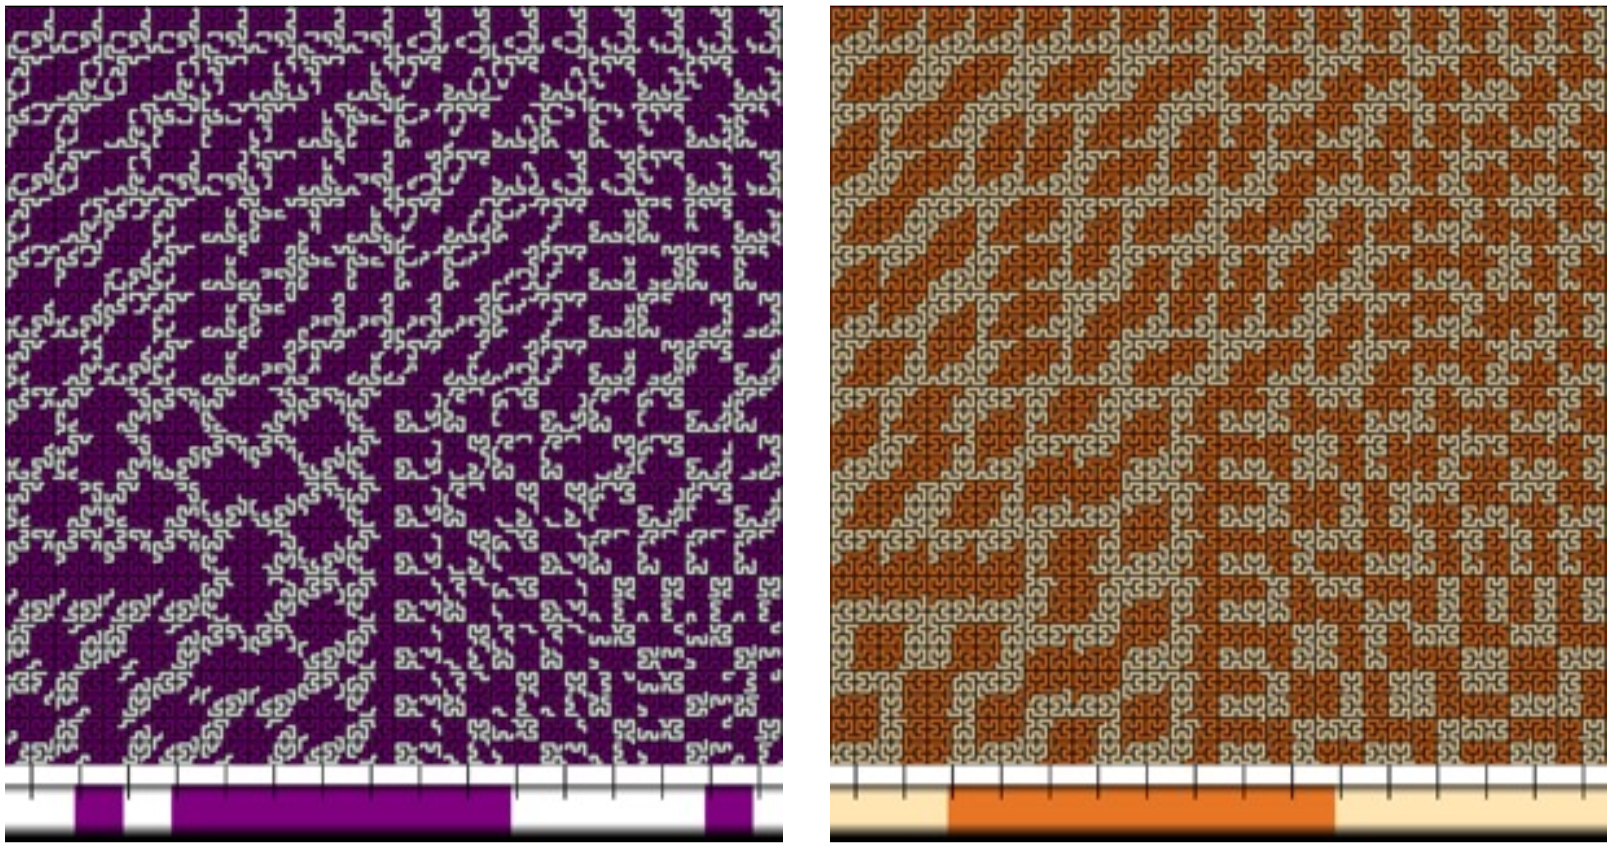
Note about thread sample: along the bottom, as a thread colour indicator strip, shows a section of
thread. This section is (in most colour modes), repeated a number of times, and so will be
scaled down on the Hilbert curve. The number of times this section is repeated in the
total curve is indicated (chosen by one of the sliders).
Tick marks, when shown on the thread colour indicator strip, indicate how a unit length of the
pattern fits over a section of the thread. There are also marks for 32 units; this number of edge units can form
a square region, so this gives an indication of blocks of colour.
This is a preliminary version, and could be improved in many ways, but is adequate to get an idea of some of
the possibilities of colour pooling on the Hilbert curve.